
As I mentioned in Saturday’s article, I’m not a gold permabull.
I’m not the guy who has been saying that gold will go up for the past 30 years and now – decades later – is finally right. (And we know there are lots of those guys around.)
There are several reasons to be bullish on gold right now. One important thing to consider is there are strong global forces pushing it higher, such as the central banks around the world selling dollars and buying gold. I covered this in detail on Saturday.
But there’s another reason to believe that this gold bull market has legs.
I came of age career-wise just prior to and during the dot-com boom. Fundamentals went out the window. It didn’t matter if a company had earnings. Heck, investors didn’t even care if it had a product or revenue. As long as it was somehow remotely related to the internet, the stock shot higher.
I needed a way to make sense of how these stocks were behaving. That’s when I discovered technical analysis, which is the study of charts.
Let’s take a look at a long-term gold chart.
When I look at the 50-year chart, something jumps out at me – and it might surprise you what it is.
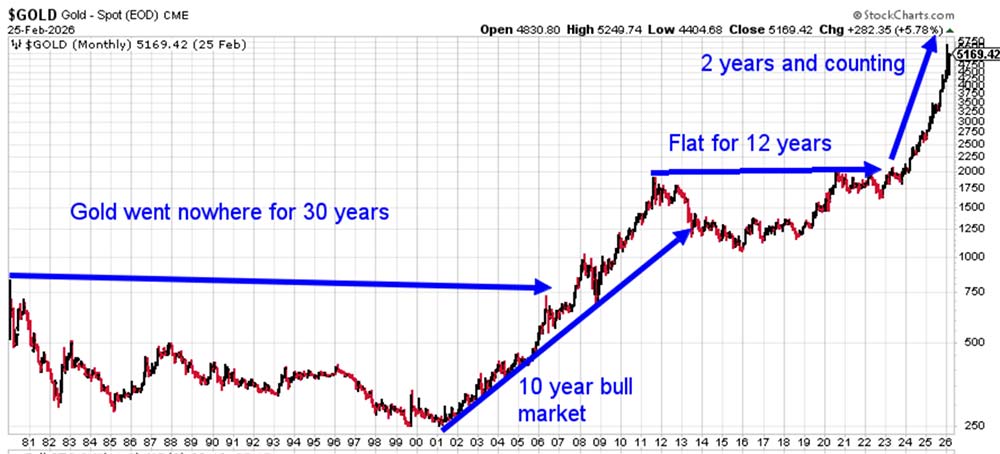
It’s not the strong 150%-plus move gold has made over the past two years (though that’s certainly notable).
What caught my attention are the very long cycles that gold operates in.
You can see that starting in the late 1970s, gold failed to achieve a new high for more than 30 years – from Carter to “Dubya,” from Elton John and Kiki Dee to Wyclef Jean and Shakira, and from Happy Days to The Sopranos.
At the bottom of that range in 2001, gold began an impressive 10-year climb from $256 to $1,921, an increase of 650%.
While a 150% move in the past two years is certainly impressive, gold’s long cycles suggest there should be a lot more upside. Even if the current bull market is just half as lucrative as the previous one, we’re looking at $8,500 gold. However, with the world looking for alternatives to the dollar and crypto nowhere near achieving reserve status, I expect gold to go higher than that.
My prediction: Gold hits $14,000 by 2034 – maybe sooner if momentum accelerates.
I remain bullish on stocks. You know that I believe dividend growth stocks should be a core part of most investors’ portfolios.
But we are likely in the early years of a long gold bull market. Having gold exposure will be an important part of growing your wealth and protecting your portfolio over the next several years.
Thanks Marc, any stock suggestions you can share for gold/related picks for the strength of our portfolios?
Thanks
I watched your Gold 20 X presentation with Mr. Goggin. I was pleased his freebie recommendation was not Elemental Royalties. I noticed that perceived royalties from Elemental can be taken in the form of a Gold Token from the Tether platform. That platform is currently illegal to trade if you are a U.S. citizen based in the U.S. The reason is obvious if you check out the owners/investors. If the “Auditor” is as careful as he advertises, I assume he is aware of those w/whom he has chosen to associate.
I noticed the same thing in 1998. My Fidelity neighbors laughed when I said gold would go to 800 an oz and then reach 3000. I went 50% into miners
The chart tracking gold’s performance is a bit misleading due to the y-axis. The chart could be more honest if done in % or something, but the spacing between 250 and 500 is deceivingly greater than between 2000 and 2250.
It’s a logarithmic scale and takes percentage into account. That’s why the difference between 250 and 500 is larger than 2000 and 2250
A barbarous relic of an ancient age, or something like that. Quotes (but not verbatim from Warren B.: Gold is “neither of much use nor procreactive”, “dug out of the ground, melted down, then we dig another hole, bury it there and pay people to stand around and guard it”. I think it’s nice and shiny and tangible, and I guess it’s good for trading.
Thanks Marc