My dad just shrugged his shoulders and said…
“What can you do?”
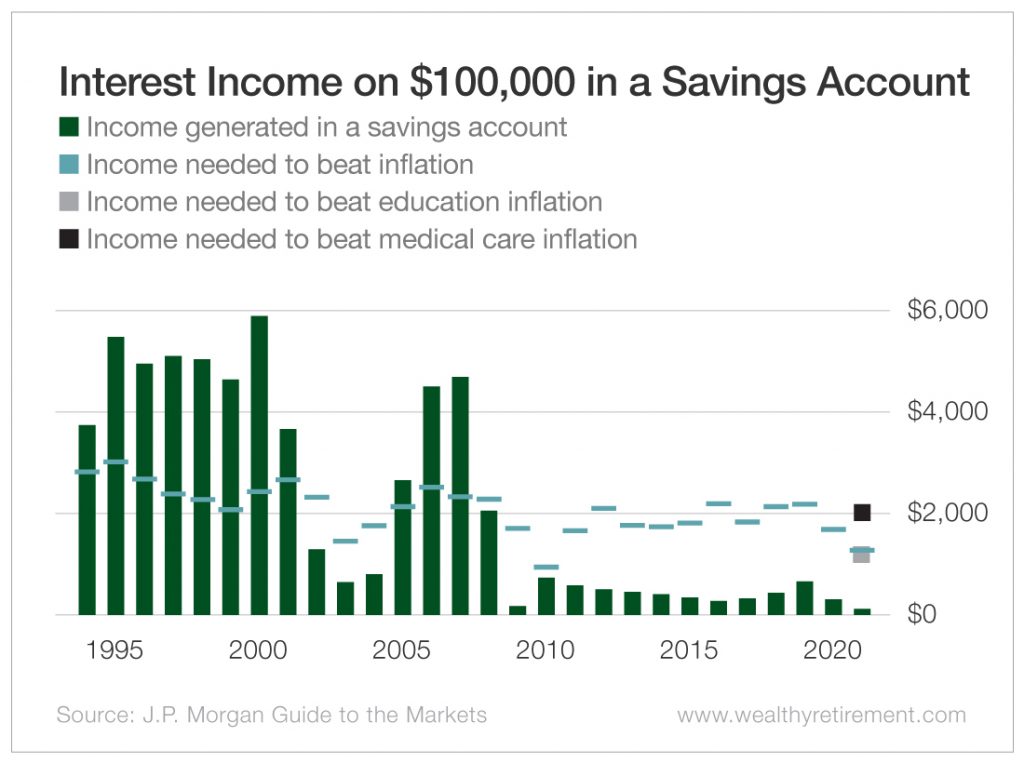
I had just shown him this chart…

My dad’s casual reaction was very different from mine…
The chart depicts how much a saver has been able to earn from $100,000 stashed in a savings account over the past quarter century.
When my parents were winding up their careers in the mid-’90s, a $100,000 savings account balance generated annual interest income of more than $5,000.
Today, that same $100,000 in a savings account generates $100 – virtually nothing!
For retirees of my parent’s generation, this is absolutely brutal and unfair.
These people worked for 30 or 40 years to build up a nest egg they could live on in retirement.
And now that they have reached their retirement years, the nest egg from that life of work pays next to nothing.
It makes me mad on their behalf.
With the nonexistent interest rates that we have had for most of the past 15 years, our society has robbed lifelong savers like my parents.
It is a breach of an unwritten social contract.
Their generation was supposed to work hard and save. These honest folks did their part for decades… only to be deserted in their retirement years.
So What Can They Do?
Savings accounts pay nothing.
Term deposits and government bonds aren’t much better.
And real estate is too labor-intensive for most retirees.
That leaves one real option.
Realistically, for people like my parents, having some exposure to the stock market is a necessary part of funding their retirement lifestyles.
The stock market currently yields more through dividend income than any savings account or term deposit.
Plus, the stock market tends to keep going up over time.
But retirees need to understand some very important things about having exposure to the stock market at this stage of their lives – because stocks are not the perfect solution for people who are living off their savings.
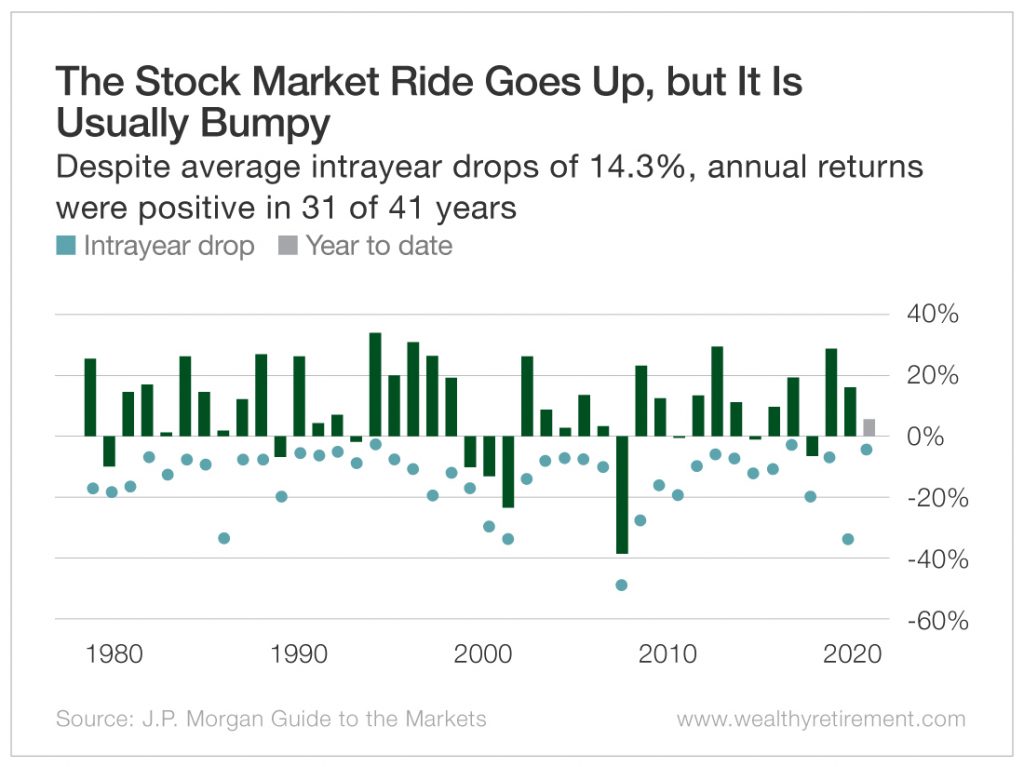
I recently showed the chart below to my parents to convince them to continue to have some stock market exposure.
Here are the key takeaways that I presented to my parents:
- On average, the stock market goes up 9% to 10% per year. That is true for the 41 years covered by this chart and for the 40 years before that. This is a proven place to keep growing your wealth.
- In most years, the stock market goes up – but not always. In 31 out of the 41 years covered in this chart, the stock market has posted positive full-calendar-year returns. That means almost one-quarter of the time, the market went down.
- While most years the market does go up, retirees need to be prepared for the fact that at some point in every single year, the stock market will be down from its starting point – and sometimes not by a small amount.In five of those 41 years, the stock market was down by 30% or more during the year. In eight of the 41 years, it was down by 20% or more. In 15 of the 41 years, it was down by 15% or more, and in 23 of the 41 years, it was down by 10% or more.On average, the stock market experienced a maximum drawdown of 14.3% each year, even though it finished ahead every year by an average of 10.4%.The stock market road goes up over time, but there are plenty of peaks and valleys along the way.
- Despite all of those big drawdowns over these 40 years, the stock market has always bounced back. Every single time.Do not lose faith.
With interest rates where they have been for a decade and a half, the reality is that most retirees probably need to be in stocks to some degree.
However, in doing so, they must be prepared to handle some volatility. Perhaps lots of it.
The key is to not panic and not cash out at the worst possible time after the stock market has one of its inevitable declines.
As long as you never have money in the market that you need within the next 18 months, riding out those bumps shouldn’t be a problem.
And remember… the market always bounces back and goes higher. We have more than a century of data to support that fact.
Good investing,
Jody

