If you’re a longtime reader of Wealthy Retirement, you probably know that I am a fan of the CBOE Volatility Index (VIX).
It’s a measure of how many put or call options are trading on the stocks that make up the S&P 500. When the VIX is high, it means more people are buying puts, which protect from further downside, than they are calls, which anticipate further upside.
More commonly, the VIX is referred to as the “panic index.” But since 2009, there hasn’t been much panic to speak of other than a couple of short-lived spikes. It’s been clear sailing until last fall – then the proverbial bottom dropped out.
First there was the escalation of the trade war with China. Then there were the midterm elections, which handed the House of Representatives to the Democrats, effectively creating a major issue for the current administration.
Then we had an escalation in the Mueller probe, with major figures receiving convictions. Headlines emerged regarding immigration and a government shutdown over the issue.
Finally came the straw the broke the camel’s back… It happened in early winter.
The Federal Reserve announced a rate hike, followed by commentary that all was well and there were more hikes to come. The comments were taken like a gallon of cough medicine by the market. The president chimed in, threatening to fire the Fed chief. Ill-advised moves played out across the board.
The market began to sell off in earnest. Investors panicked. And the ground was laden with opportunities for investors who study the movement of the VIX.
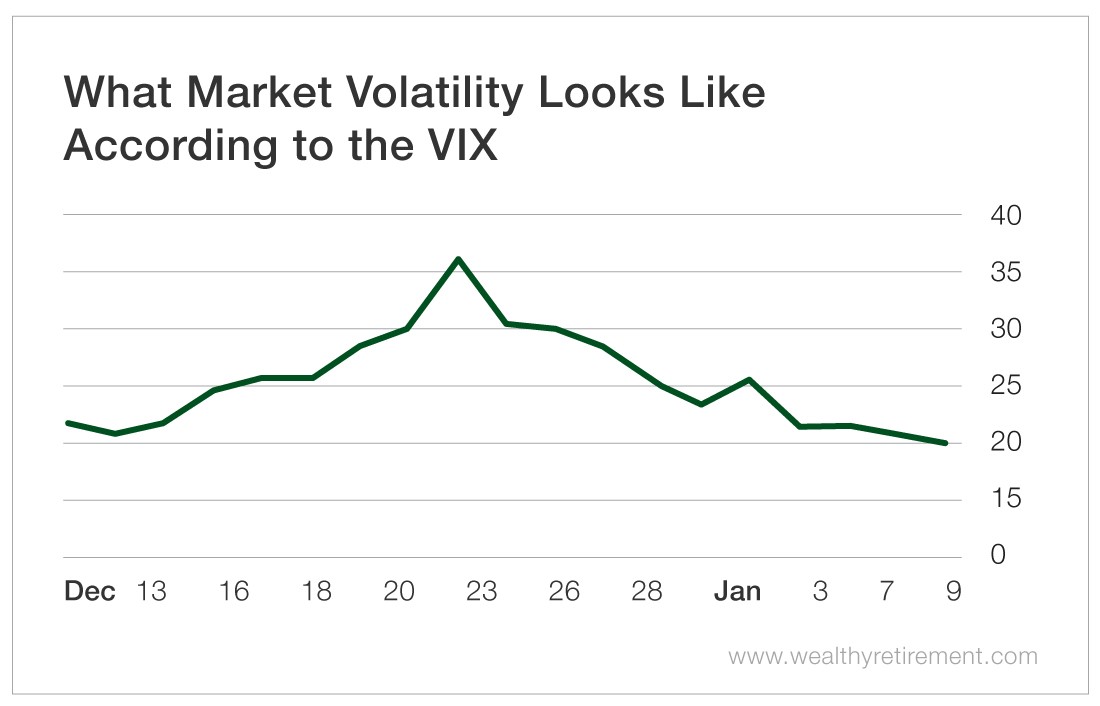
As you can see from the chart below, the VIX spiked from around 20 in mid-December to more than 36 on Christmas Eve, when the market had its worst one-day sell-off since February 2018 and the worst Christmas Eve ever.
This move in the VIX equates to an 80% increase in volatility in less than two weeks. That was reflected by the market’s insane moves over that time frame.
But that’s not what you should be paying attention to…
You should be focused on something I have repeated in talks and articles about the VIX: Panics do not last as long as complacency.
The same chart shows that in a short-term panic (unlike the one in 2008 to 2009, which was a panic accompanied by a massive recession), the VIX will change direction in a hurry.
On the days leading up to Christmas and on Christmas Eve, I deployed more capital into the market than I have in a couple of years. I followed my own advice.
When the VIX trades between 10 and 15, it means that investors are complacent and you should reduce exposure to stocks. When the VIX is between 15 and 20, you have a normal trading range. Between 20 and 25 – where the VIX is now – investors are jittery.
When the VIX trades at more than 25, I start lining up companies I would like to buy in the event that we are in the very early stages of a correction. Confirmation will occur once we jump above 30 and enter correction territory.
Once the VIX passes 40, you are in a panic. Between 30 and 40 – like we were on Christmas Eve – I am steadily deploying cash on companies on my wish list.
Barring any news that is irreversible in the short term, such as a recession, the markets almost always revert to their long-term averages. The VIX is no different.
Panics do not last as long as complacency. That’s why, when you encounter a panic situation, you can often get the best bargains the market has to offer.
Good investing,
Karim
