One of the most common questions I receive is “I’m looking at XYZ stock, and it pays out more in dividends than it makes. How can the company afford to pay that dividend?”
The answer is cash flow.
I talk about this a lot in my Wednesday Safety Net column, where each week I analyze the safety of a different company’s dividend using my proprietary system SafetyNet Pro.
There is a big difference between earnings and cash flow that is essential to understand: Earnings include noncash items, such as depreciation, amortization, stock-based compensation, etc.
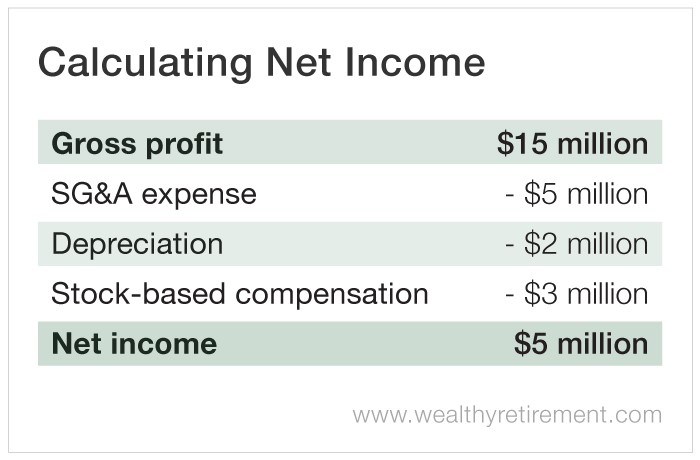
Here’s a simple example. Let’s say a company’s gross profits are $15 million. It has $5 million in operating expenses – such as sales, general and administrative – leaving it with $10 million.
Two years ago, it bought equipment for $10 million, which depreciates by $2 million each year and is taken as an expense.
Now, this is important…
The company paid $10 million for the equipment two years ago, but it is taking a $2 million depreciation expense now.
It didn’t send $2 million out the door this year, yet it can list this as an expense on the income statement, reducing earnings.
Additionally, the company gave employees stock options valued at $3 million. Again, the company did not write a check for $3 million, but the stock-based compensation is taken as an expense and lowers net income.
Now the company’s profits are $5 million.
If the company paid shareholders $6 million in dividends, one could look at the financials and say, “It made only $5 million but is paying out $6 million, so the dividend is not sustainable.”
But if we look at cash flow, it tells a different story.
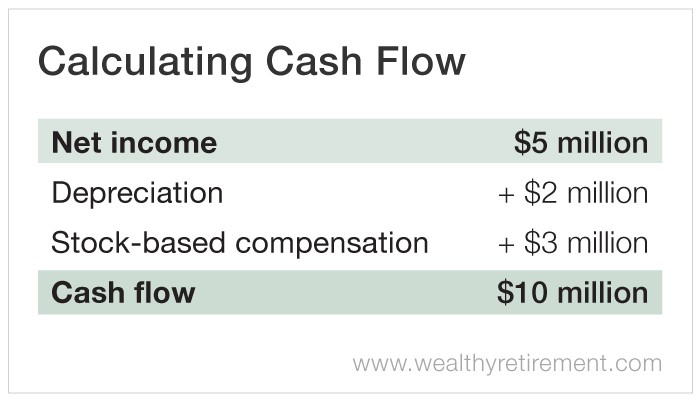
Cash flow measures only the cash that came in or went out. So to arrive at how much cash flow the company generated, we’d add back the noncash items (deprecation and stock-based compensation) to net income.
Technically, the company’s earnings were $5 million. But it actually brought in $10 million in cash.
That’s why I look at cash flow when it comes to determining dividend safety.
In our example, an investor who considers net income concludes the company can’t afford the dividend it’s paying to shareholders.
But one who factors in cash flow sees that it took in $10 million while paying $6 million in dividends. That’s a 60% payout ratio, which is perfectly reasonable.
The investor who uses earnings to calculate payout ratio (which is what most investors do) comes up with 120%.
Both numbers are correct. The company paid 120% of its earnings out in dividends, but it paid out only 60% of the cash it generated.
Let’s look at a real-world example.
In 2018, Las Vegas Sands (NYSE: LVS) earned $2.95 billion, but it paid $2.98 billion in dividends. In other words, it paid out 102% of its profits in dividends.
But it generated $3.75 billion in free cash flow.
So in reality, it gave shareholders 79% of the cash it generated. That sounds much better and is a more accurate representation of the casino operator’s ability to pay its dividend.
Cash flow isn’t as commonly reported as earnings, but it is the most important metric when analyzing a company’s dividend safety.
Good investing,
Marc


