The market continues to treat traditional automakers with caution. Even for those with solid profits and steady cash flow, valuations remain low as investors weigh the cost of shifting to electric vehicles and the demands of a capital-heavy business.
General Motors (NYSE: GM) sits squarely in that gap.
The stock’s performance so far in 2026 reflects doubt about how durable its cash flow really is, while the underlying results point to a business that has remained steady.
The difference between those views becomes clearer when the numbers are examined together.
General Motors is a global automaker founded in 1908, with operations across North America, China, and other international markets. The company produces trucks, SUVs, cars, and parts while investing in electric vehicles, autonomous driving (through its Cruise subsidiary), and software-based services.
In the fourth quarter of 2025, General Motors reported revenue of about $45.3 billion, slightly below the $47.7 billion it made a year earlier.
For the full year, the company generated just under $19 billion in operating cash flow, which reflects the cash produced by its core business. It returned around $7 billion to shareholders through dividends and share buybacks.
Total automotive liquidity, meaning available cash and credit, stood near $36 billion, while automotive debt was about $16 billion. For a company this large, that amount of debt doesn’t concern me. The debt-to-capital ratio, which shows how much of the company is funded by debt as a percentage of total capital, was a healthy 35%.
Over the long term, the stock has trended upward, recovering from earlier cyclical lows. For the past six to 12 months, it has mostly moved higher, pointing to improving sentiment. It did pull back a bit in February and March, but overall, the trend has been stable, suggesting the market is holding its current view rather than shifting direction.
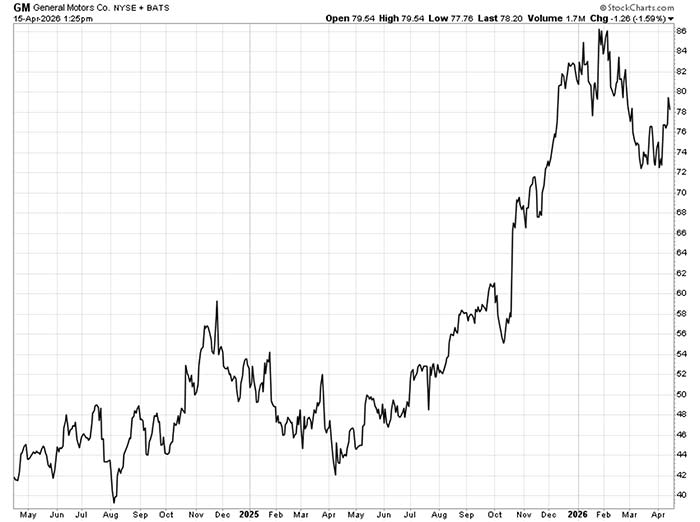
Still, that kind of price action raises a straightforward question: Was the recent decline a result of broad skepticism about legacy automakers… or concerns about the company itself?
The Value Meter framework helps clarify that disconnect.
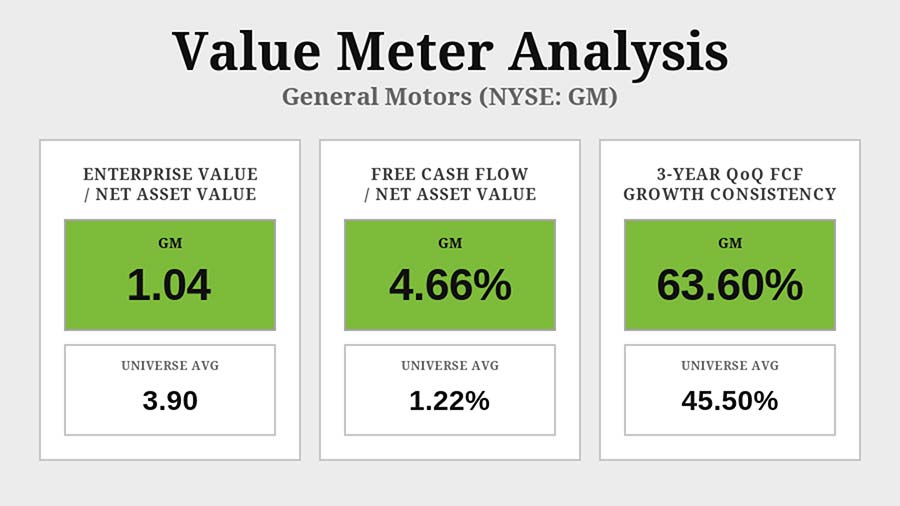
General Motors trades at an enterprise value-to-net asset value ratio (EV/NAV) of 1.04, compared with a broad market average of 3.9 – a discount of about 73%. The market is valuing the company only slightly above the value of its underlying assets.
Over the past 12 months, the company’s free cash flow-to-net asset value (FCF/NAV) percentage was 4.66%, 284% higher than the market average of 1.22%. This means General Motors produces far more cash relative to its asset base than the typical company.
At this valuation, that level of cash generation gives the company room to reinvest, reduce debt, or return capital without leaning on outside funding. It also points to a stronger return profile than the stock price suggests.
Over the past three years, quarterly free cash flow has increased over the prior quarter about 63.6% of the time, versus a 45.5% market average. That reflects steady execution rather than one-off gains. For investors, that consistency reduces dependence on favorable economic cycles.
The key issue is whether the market’s discount reflects real long-term risk or continued caution. The company’s operating record indicates that it’s more about caution. General Motors combines strong cash generation with a stable growth pattern, yet it trades very cheap – close to the value of its assets.
The pricing suggests more instability than the recent results show.
Bottom line: The market is pricing General Motors as a low-multiple business with uncertain cash flow. However, the data shows a consistently cash-generative company trading at a steep discount.
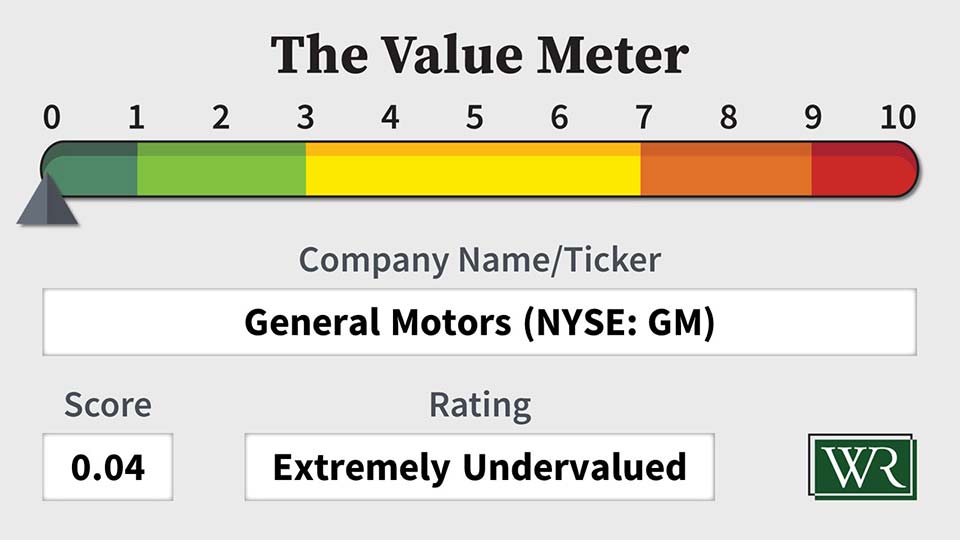
The Value Meter rates General Motors as “Extremely Undervalued.”
What stock would you like me to run through The Value Meter next? Post the ticker symbol(s) in the comments section below.
Run these stocks thru the Value meter and let us know what it shows: AZZ, POWL. COHR, DELL, PL, AMD
GM’s diesel engines are problematic! They don’t have a keyway cut into the crankshaft with a key, what they have is a little stud that keeps the harmonic balancer positioned properly and that fails on a regular basis causing engine damage. And there is a nut associated with the intake manifold that rusts and then will fall into the intake and on to a piston, not good! The turbo charged engines fail also because the turbos fail prematurely.
MDA Canadian stock
Thank you for analyses.
What range of price will you recommend buy?
Are you going to let us know where to sell?
rdw
QUBT
I’d be interested in both the valuation of CSCO, as well as the safety of its dividend.
KHC
How about 3 of them: PDK, PDI, MAIN
vst
Excellent article and analysis. Please run DELL through the value meter to see what comes up, and again, many thanks!