
Chances are you didn’t notice that asset managers spent the majority of last year trading below the broader market.
Truth be told, it’s not a very exciting industry. It rarely makes the headlines. But that’s where true value may rest its head.
Fee pressure, passive flows, and doubts about older franchises were the go-to reasons for the underperformance. Even the firms that still produced strong cash were priced as if their best days were over.
Franklin Resources (NYSE: BEN), known to clients as Franklin Templeton, has been one of the more resilient names in the sector. It manages $1.7 trillion in global assets across every asset class you know well (and those you don’t), serving retail, institutional, and high-net-worth clients internationally.
And it’s doing a decent job of it.
In the quarter ending in March, Franklin posted $2.3 billion in operating revenue, up 9% from $2.1 billion a year earlier. Net income nearly doubled from $151.4 million in the same quarter a year ago to $268.2 million.
Long-term net inflows reached $16.9 billion. The year before, the firm had $26.2 billion in net outflows. That’s a stark shift.
Franklin Resources returned $234.6 million to shareholders during the quarter. That total included $177.5 million in dividends and $57.1 million in share buybacks.
Cash and investments stood at $6.2 billion against $1.8 billion in long-term debt. That debt figure puts the company’s debt-to-capital ratio – the share of funding that comes from debt versus equity – at roughly 12%.
The stock spent most of 2024 and early 2025 stuck in the high teens, going nowhere. Then it climbed through the back half of 2025, dipped into the low $20s in November, and has since pushed back up near $29.
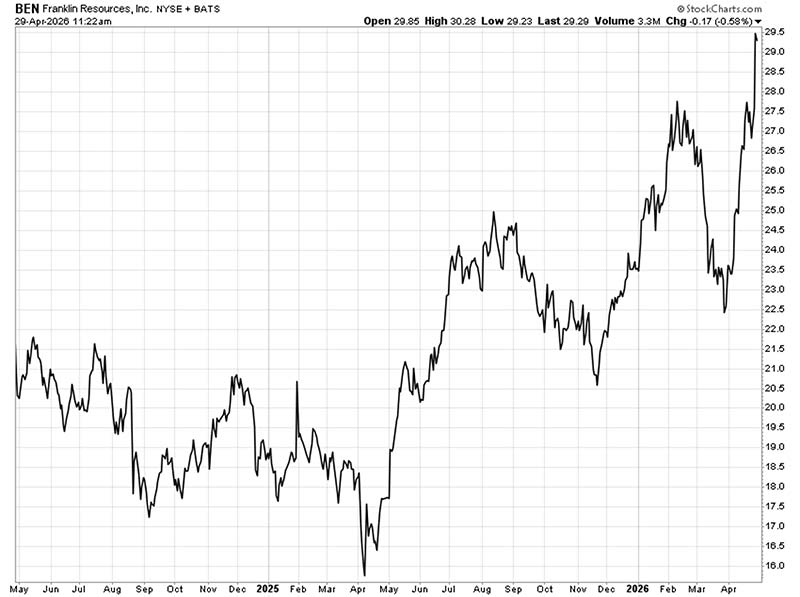
The market has clearly started to pay attention. The question is whether it’s paying a fair price for the stock.
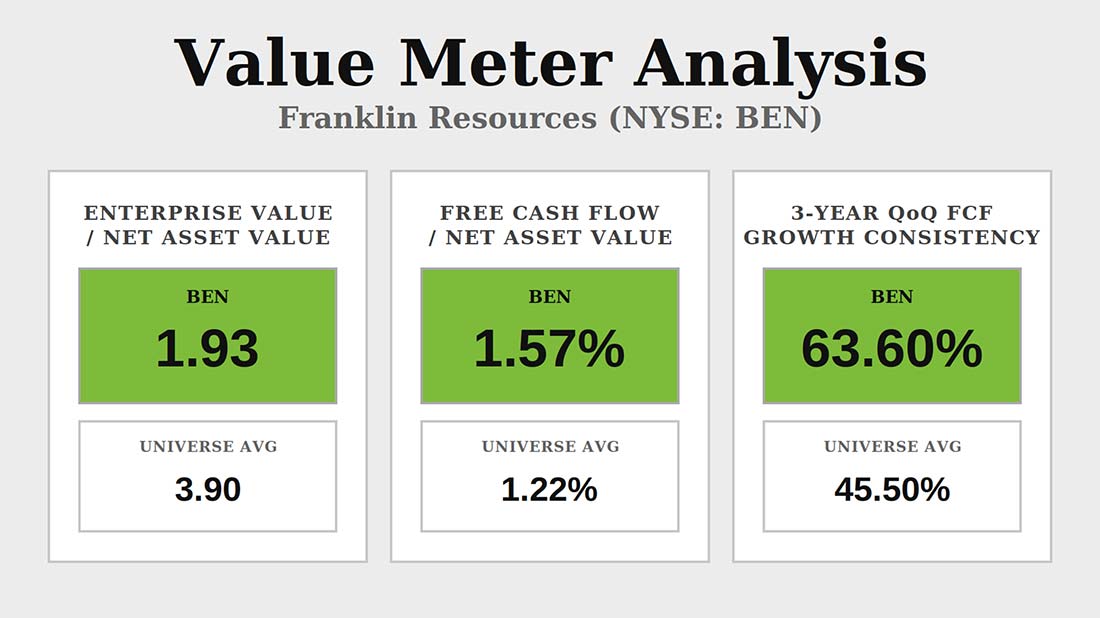
Investors are paying about half as much for each dollar of Franklin’s net asset value as they do for the average company. Franklin’s enterprise value-to-net asset value (EV/NAV) ratio sits at 1.93, against a broad market average of 3.9 – a gap of about 51%.
Not only does each dollar of Franklin’s assets cost less than the average dollar in the market; it’s also producing more cash. Over the past four quarters, the firm’s free cash flow-to-net asset value (FCF/NAV) ratio reached 1.57%, roughly 29% ahead of the broad market average of 1.22%.
That combination – stronger cash output paired with a lower multiple – is what lets buybacks and dividends compound value without the share price needing to rise.
Franklin’s quarterly free cash flow has grown over the prior quarter about 64% of the time across the past three years, which is above the broad market average of 46%. Growth in two of every three quarters isn’t luck – it’s what a stable fee base, disciplined expenses, and recurring revenue produce.
For someone buying at today’s price, that steadiness narrows the range of cash outcomes the discount is built around.
So one question remains: Is the discount on Franklin about Franklin… or about the sector it sits in?
The cash generation rate sits above the market average. The consistency of that generation sits even further above the average. The numbers describe a firm that’s priced for problems its record hasn’t shown.
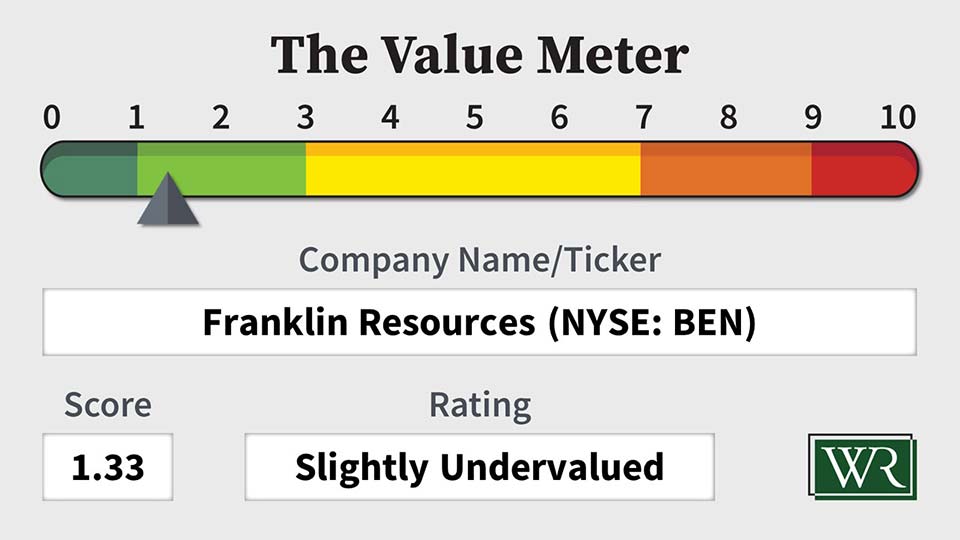
The market is pricing Franklin Resources as a business in slow decline. The numbers describe something steadier.
The Value Meter rates Franklin Resources as “Slightly Undervalued.”
What stock would you like me to run through The Value Meter next? Post the ticker symbol(s) in the comments section below.
Elf Laboratories
OWL
BEN is a slightly undervalued stock that over the long haul, will provide a return that is less than the 4.5% CD I currently receive for money that is just sitting. If you are looking for some growth over time, and a dividend that when combined provide an 8.5-12% return – Then invest in SPG- Simon Property Group. They are a very conservative REIT that is now 3 generations run, and reinvesting Dividends for more stock over time will only increase your net wealth. Started in Indianapolis by Simon Brothers that become known as the Strip Mall Kings of Indy. Then David Simon Took over, (Generation #2), developed and built Mall of America as an experiment, and created the Concept of The Mall becoming an Experience where you can go for a full day) vs. just shop for an item or two. David brought in high end client retails that could pay his rent while he redeveloped the on-sight property so families could enjoy a day at the Mall while shopping. David just passed from Cancer but his son has now taken over. I was a classmate of David’s @ Indiana University and I can tell you, – he was a genius. BUY SPG, Forget stogy old BEN.- Have cash on the side and every time there is a market down turn, buy a few share of SPG. 20 years from now, YOU WILL BE VERY HAPPY!
Steve Scott
Qcom
Years ago I inherited a Franklin fund when my Dad died. What a disaster that was! Horrible performance for years, assets moving down. I tried to get some information from company reps about why it was so bad to no effect. They were totally unconcerned about it, and told me to sell my position if I was unhappy with it, which I did. I think Franklin is a fundamentally second-rate (or even third-rate) company with high fees and inferior results. I would never own another Franklin fund. I can also tell you that their municipal bond funds were managed on a current yield basis rather than total returns, which is fundamentally wrong….So, overall, an inferior company from fund shareholders’ welfare point of view……Do you really want to own a company like that???
This is a good description of the “current state” of BEN. I would like to have seen comments on the direction the company has mapped out for the next 3-5 years.
How about TRowe Proce “trow”. Or possibly ARCC. Thank you!!