
The Value Meter was never built to chase returns. It was built to answer a narrower question: What am I actually paying for the cash this business produces?
That difference matters when you look back at the results – and when you’re honest about what they do and don’t say.
Let’s start with what’s worked.
Across both 2024 and 2025, stocks rated as undervalued by The Value Meter − that is, stocks that scored below the midpoint on our scale − beat the S&P 500 on average.
In 2025, that gap widened. Undervalued stocks gained roughly 26% on average in less than seven months, beating the market by more than 15 percentage points.
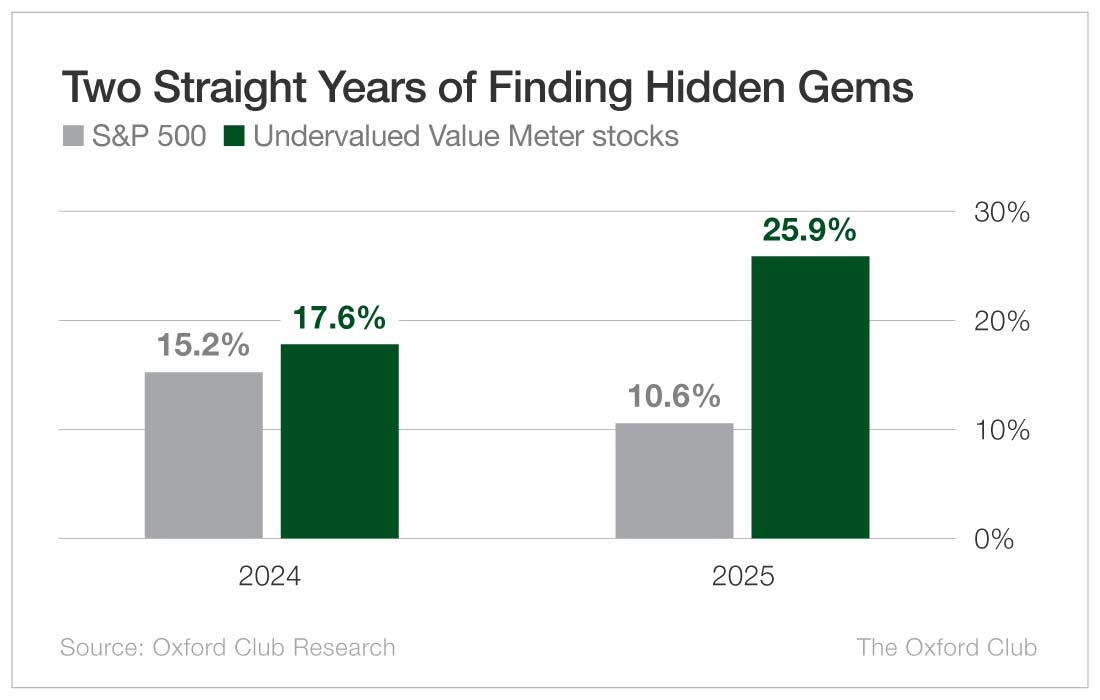
In 2024, undervalued stocks delivered better returns, higher win rates, and stronger relative performance than overvalued stocks.
That’s exactly what you’d expect from a system focused on cash generation and asset efficiency.
The Value Meter gave undervalued ratings to a number of breakout stocks in 2025 as well, including infrastructure provider Vertiv Holdings (NYSE: VRT), tech manufacturer Applied Materials (Nasdaq: AMAT), and even $4.5 trillion market cap Nvidia (Nasdaq: NVDA).
By the end of the year, these three stocks were up 91%, 90%, and 53%, respectively.
But now comes the part that’s less comfortable.
In 2025, stocks flagged as overvalued didn’t lag. They led.
While undervalued stocks were more likely to outperform the market, overvalued stocks had a higher average return. On the surface, that looks like a miss. But markets don’t price stocks on cash flow alone – especially in the short run.
They price momentum. They price stories. They price what might happen next. When liquidity is plentiful and narratives take hold, stocks can trade far above what their assets and cash flows justify.
And they can stay there longer than fundamentals would suggest.
A system like The Value Meter isn’t built for that environment. It penalizes weak cash generation and expensive balance sheets. By design, it will lag when speculation outruns discipline.
That isn’t a flaw. It’s the trade-off.
The Value Meter is biased toward durability, not excitement. It assumes that cash will eventually matter more than optimism. That assumption doesn’t help you time tops, but it does help you avoid paying too much for businesses that don’t earn what they’re priced to deliver.
The results from 2025 were a reminder of something every investor relearns sooner or later: Markets can stay disconnected from fundamentals longer than you expect.
The data doesn’t owe you immediate validation. And no system – no matter how grounded – is ever a finished product. That doesn’t call for a teardown. It calls for discipline.
The Value Meter isn’t meant to win every sprint. It’s meant to keep investors from overpaying for fragile businesses when enthusiasm is doing most of the work. When the market remembers that cash pays the bills, that discipline matters again.
It always does.
Please check the value meter on: GitLab, CRM, and Big Bear.
BCE. tx
Anthony,
Recently (6 months ago, or so) Alex made a comment that CODY was a company similar to Berkshire Hathaway. It was lead by a Canadian financial guru with a similar approach to the market. Alex said the shares were a bargain at less than $12. That this was a buy and hold stock. Can you please run tis one through the value meter?
Thanks for the strong reminder on value and companies that run way ahead of that on enthusiasm. I was surprised by the S and P 500 number you gave for 2025: 10.6%? Most of what I have seen and heard for last year was 17.9% return or 16.4%. Not sure if different measurements are being reflected in all that. Can you explain your lower number?
Hi Tim, good question. You’re right that this is not the full-year gain for the S&P 500. To ensure we used the fairest method of comparison, we took the gain of each undervalued Value Meter stock from the day it was evaluated to the end of 2025, and then we compared it to the gain of the S&P 500 over the same time frame. (This is the standard way of comparing stock returns to a benchmark index’s returns over multiple time frames.) The average time frame was about 188 days. So, to put that data in the chart into words: “The average undervalued Value Meter stock in 2025 gained 25.9% in 188 days, while the S&P 500 averaged only a 10.6% gain over the same time frame.” Hope this helps!
Anthony, I am going to ask once again.. Are these actual recommendations? And if so in what Oxford club portfolio?
Hi, kellydunn. The Value Meter is intended to educate Wealthy Retirement readers on how to reduce bias and evaluate stocks’ valuations objectively. These are not official recommendations, so they are not tracked in any Oxford Club portfolio.
Hey Anthony.
Berkshire Hathaway doubled down on Constellation brands over the past year. Would love to read your thoughts on Constellation Brands.
Thank you for all you do!
Is there a place on the website to find a list of your 2026 value meter stocks?
Hi, Glenn. There’s not a list of the stocks themselves, but if you go to this link, you can view the full archive of Value Meter articles: https://wealthyretirement.com/topics/income-opportunities/the-value-meter/
Every time a new Value Meter article is published (they come out on Fridays at 4:30 p.m. ET), it should automatically appear on that page.