Retail stocks have been under pressure for the better part of two years. Cautious consumers pulled back on discretionary spending, traffic fell, and the market marked down many established names – often more than the fundamentals warranted.
However, The Value Meter doesn’t weigh sentiment – it reads the cash flow record. In the case of one iconic retailer, that record tells a different story compared with the rest of the sector.
Target (NYSE: TGT) operates nearly 2,000 U.S. stores and offers six merchandise categories, including food and beverage, apparel, beauty, home goods, hardlines, and household essentials.
The company’s 2025 fiscal year (which ended in January) produced net sales of $104.8 billion, down 1.7%, as comparable sales fell 2.6%. Net earnings declined 9.4% to $3.7 billion, while operating cash flow fell 11% to $6.6 billion. Approximately $2.5 billion went back to shareholders through dividends and repurchases. The company ended the year with $5.5 billion in cash and $16.5 billion in total debt.
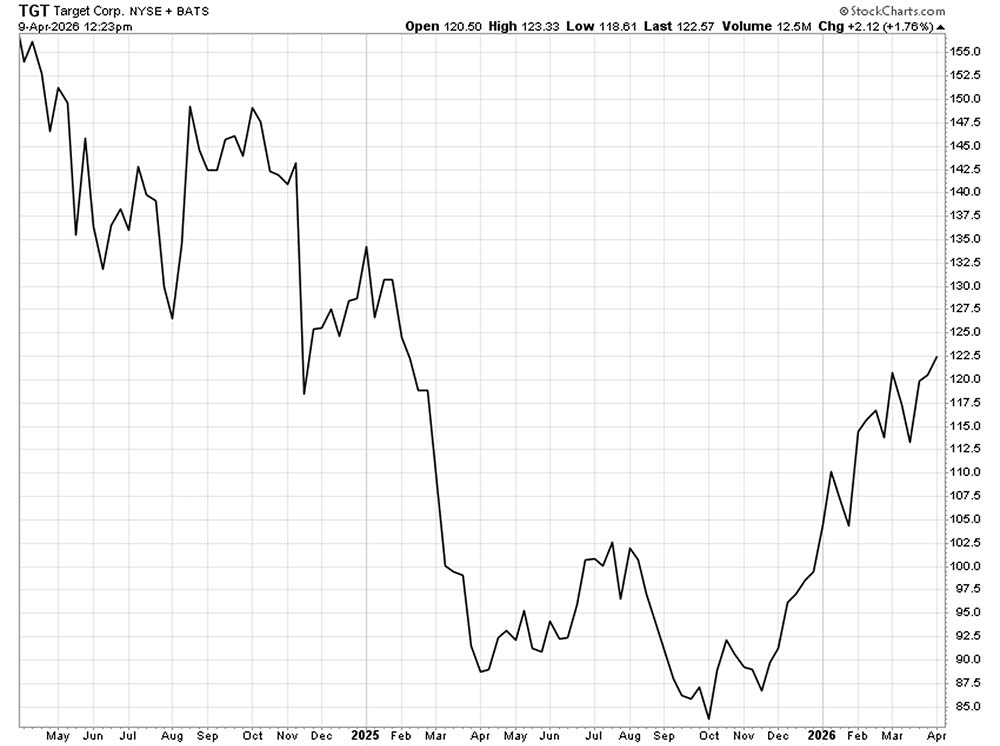
The stock fell more than 40% between mid-2024 and late summer 2025. That sell-off reflected both deteriorating sales and a broader reassessment of consumer discretionary names. The stock has since recovered toward $122, though shares remain roughly 20% below the 2024 peak.
That gap between the recovery and the prior high is worth examining carefully. A stock that reprices this sharply tends to carry either a genuine fundamental discount or a lingering sentiment overhang.
The Value Meter is designed to distinguish between the two.
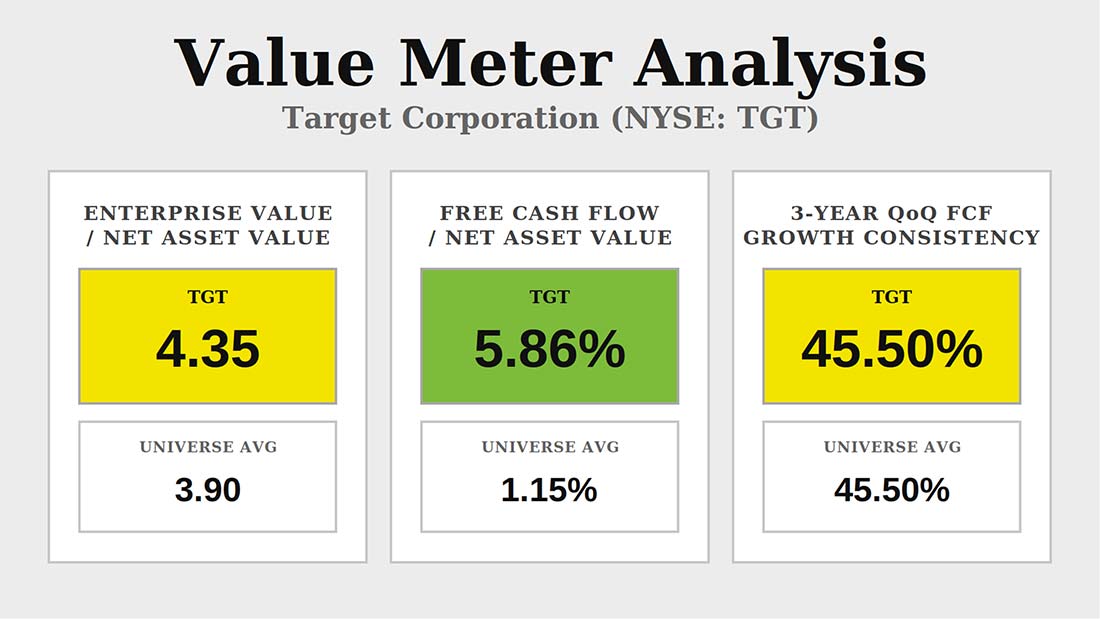
Target’s enterprise value-to-net asset value (EV/NAV) ratio of 4.35 sits about 11% above the broad market average of 3.90. That premium puts the investor above the market.
Against a broad market average of 1.15%, Target’s free cash flow-to-net asset value (FCF/NAV) of 5.86% represents a gap of roughly 411%. That gap is not incidental. At that rate, the business generates cash fast enough to build underlying value for shareholders even without a stock price recovery.
After accounting for the EV/NAV premium, the investor still collects free cash at roughly five times the market average rate.
Target’s quarterly free cash flow grew over the prior quarter 45.5% of the time over the past three years, matching the broad market average. That rate has survived two years of falling comparable sales and declining store traffic – conditions that typically hurt cash generation. For the investor entering today, that makes the FCF picture more attractive than the earnings trend suggests.
The natural question when a company’s cash-efficiency runs this far above the market average is whether something in the business undermines it. The consistency score says no – this number has held at a level most companies would struggle to maintain. The EV/NAV premium is a real offset, but at just 11% above average, it narrows the value case rather than closing it.
Together, they describe a business the market has marked down on earnings without fully pricing in what the cash statement shows.
The market is pricing Target as a retailer in structural decline. Yet the cash flow data describes a business that’s generating free cash at well-above-market-average rates.
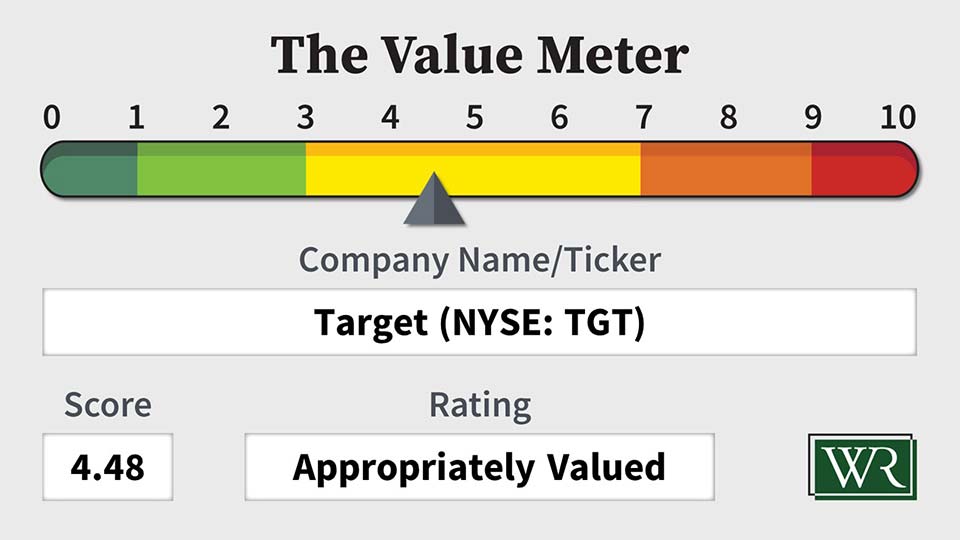
The Value Meter rates Target as “Appropriately Valued.”
What stock would you like me to run through The Value Meter next? Post the ticker symbol(s) in the comments section below.
Nvo
trow