

NeoGenomics (Nasdaq: NEO) isn’t your typical cancer-focused healthcare company.
For one, it doesn’t develop drugs. It works behind the scenes, providing the testing and lab services that doctors and drug companies rely on.
That makes NeoGenomics something of an infrastructure play on cancer care and research. Its work helps doctors identify tumors, choose treatments, and track how patients respond.
It also works with drug companies on clinical trials and new cancer tests.
It’s a solid business model. And the numbers show it.
In the second quarter, revenue rose 11% to $202 million. Clinical revenue grew 14%, while sales from next-generation sequencing, a technology that is key to the company’s business, jumped 26%.
Profitability improved too. Adjusted EBITDA (earnings before interest, taxes, depreciation, and amortization) climbed 36% to $14 million, and the company generated $20 million in operating cash. Management also raised its full-year revenue and adjusted EBITDA guidance.
NeoGenomics’ stock has been on a tear. Just this past spring, it traded below $8. Now, as we enter the fall, the share price has more than doubled to a new 52-week high.
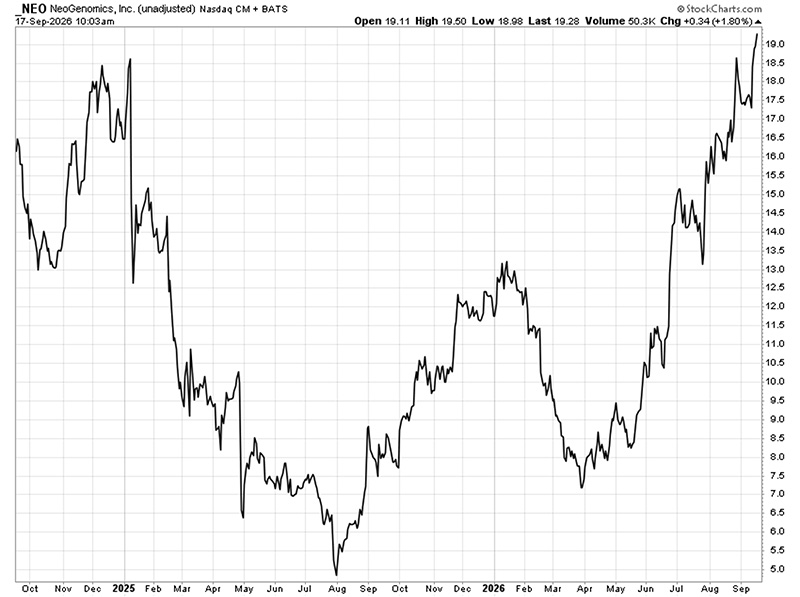
A move like that often signals a shift in investor confidence. In NeoGenomics’ case, the business has given investors more reason to feel optimistic.
But is a move this large justified? And is there still more room to run?
Let’s see what The Value Meter says about this one.
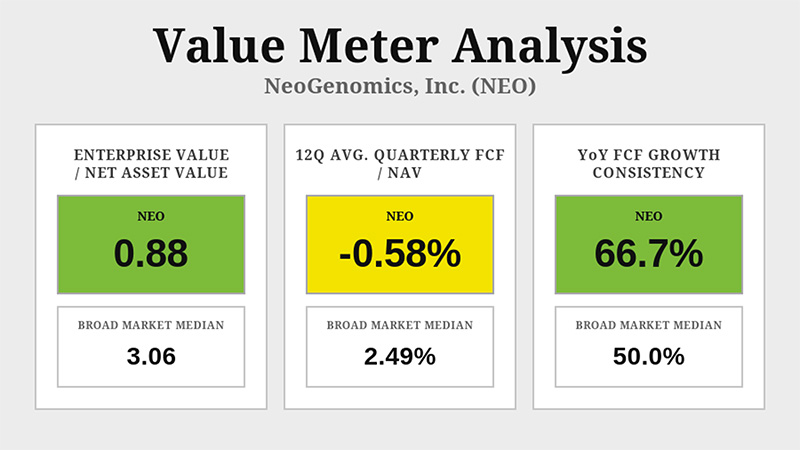
NeoGenomics’ enterprise value-to-net asset value ratio, or EV/NAV, is 0.88, compared with 3.06 for the median stock in the Value Meter universe.
That’s obviously a huge discount, but a cheap price tag only gets us so far.
We also want to know whether those assets are helping the company produce cash. On that front, NeoGenomics still has some work to do.
Its average quarterly free cash flow-to-NAV is -0.58%, compared with 2.49% for the broader market. This metric takes NeoGenomics’ average quarterly free cash flow over the past three years and compares it with its average net asset value over the latest two quarters.
To be clear, we’re not saying today’s assets produced all of that past cash flow. We’re using the two together to judge how the company’s cash record stacks up against its current assets.
Over that three-year stretch, the cash result has been slightly negative.
On the other hand, NeoGenomics’ year-over-year free cash flow growth consistency has been 66.7%, versus the market’s 50%. In other words, quarterly free cash flow has improved from what it was a year prior two-thirds of the time.
That tells us the cash picture may not be strong yet, but it has been moving in the right direction with more consistency than the typical stock.
That also helps explain why The Value Meter doesn’t treat NeoGenomics like a simple bargain or an obvious problem. The stock looks cheap against its assets, but the cash generation record is still weak, albeit improving.
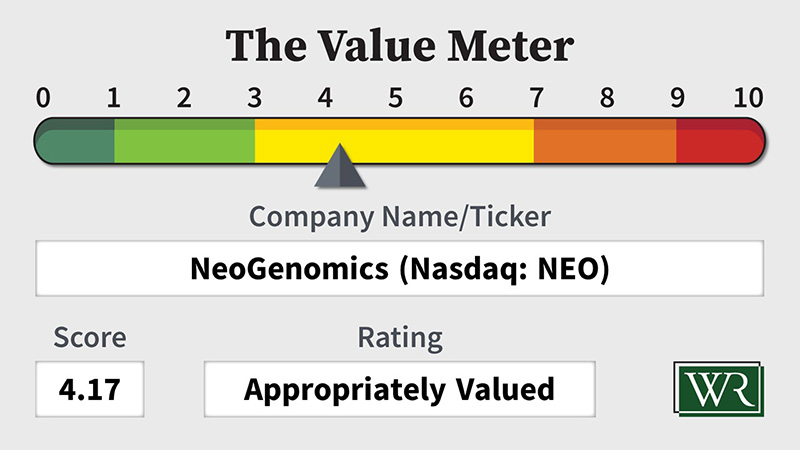
The Value Meter rates NeoGenomics as “Appropriately Valued.”
What stock would you like me to run through The Value Meter next? Post the ticker symbol(s) in the comments section below.