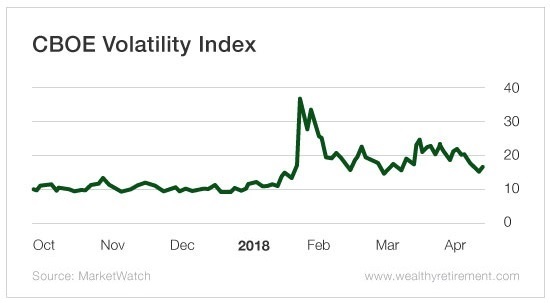
Volatility hasn’t been of much concern for the past five years.
As you can see below, the CBOE Volatility Index (VIX) was tame heading into January.
It was almost too tame…
That isn’t normal!
The VIX measures market volatility by gauging how many put and call options are being bought and sold on stocks in the S&P 500.
Many believe the VIX is a leading indicator… It isn’t.
The VIX is a lagging indicator. It reacts to what is happening in the market… It doesn’t cause things to happen in the market.
But once it rears its head, people begin to use it as a real-time measure of what is going on. That can be effective in the short term, as it is a direct and accurate reflection of the market.
I use the VIX all the time. It is one of the many indicators that allow me to gauge the direction of the market, how fast it’s moving, and how much panic or complacency exists.
And I do know one thing for sure: Complacency can last for a long time. Panic does not.
Get out a notepad and write this down: The sweet spot for the VIX is its historical range, between 15 and 25.
It’s not normal for the VIX to trade below 15 and stay there. The lower it trades, the less normal it is. A reading between 9 and 15 reflects market complacency; it’s a warning sign if it stays there too long.
And if the VIX drops below 9, you should be looking over your shoulder. In the fourth quarter of last year, the VIX traded below 10. A reading that low (or below 9) should really scare the heck out of you. It means investors are a little too relaxed.
In these situations, you should lighten up on stocks. Instead, you should buy puts. That’s because when volatility is low, options are cheaper. As volatillity increases, stock prices will nose-dive and you’ll be able to profit from the market drop.
Back to that notepad… When the VIX is trading above 25, the market is experiencing above-normal volatility. This is when you should start dipping back into the market. It’s also when you should sell options to collect higher premiums.
When the VIX is above 30, we are entering a mini correction. Start buying more stocks and selling more puts. (Just for some perspective, the VIX was trading above 30 during the recent mini correction in February.)
When the VIX moves above 40 – a very rare occurrence – it’s time to accelerate your purchasing.
Finally, when the VIX goes above 50 or 60, it’s time to take out a second mortgage and go all in! The VIX has jumped to levels above 70 just once – during the lows of the 2008 and 2009 correction.
If you were buying then, you would have increased your wealth severalfold in the years ahead. Even putting your money into an index fund would have made you four to five times your initial investment.
Now that you know what levels to look for, how do you “play” the VIX easily?
There are several exchange-traded funds and options that give you exposure.
My favorite is the iPath S&P 500 VIX Short-Term Futures ETN (NYSE: VXX). This is an exchange-traded note (ETN) that should be used for only short-term trading or protection during volatile periods. It is NOT meant to be a long-term holding.
When the VIX starts moving above 15, you can buy shares of this ETN. It will begin to move higher as the market goes lower. At the beginning of the most recent correction in mid-January, the Short-Term Futures ETN was trading as low as $25.50. By the peak of the correction, it was trading above $55.
Since this is a short-term fund, you need to treat it as you would an option. Remember, the time to start selling is when the VIX moves above 30. You should be all out by the time the VIX jumps above 40.
Shares of the Short-Term Futures ETN are easy to trade on any exchange and through any broker. Because the ETN uses futures on the VIX, it will lose value over time as result of “leakage,” meaning new futures must be bought and old futures near expiration must be sold. Therefore, you should never buy this for longer-term protection.
For that, you should buy a longer-term security, which I will share with you next week.
Good investing,
Karim

